What is SCDT?
The supply chain digital twin, the SCDT, is a tool that simulates and visualizes supply chain arrangements and factory workflows to provide a visual representation of the factory inputs, outputs, and internal processes as well as the interaction between the factories in the supply chain.
The SCDT provides detailed information about simulated entities of the factory logistics such as factory resources, products, status of internal processes, waste, buffer zones, CO2 emissions or energy consumption, as well as the interaction between the factories, suppliers and consumers in the supply chain.
The complexity of the simulated operation of each factory is scalable and can be tailored to suit the needs of any particular factory. In its simplest form, each factory is a set of inputs with at least one process, converting them into outputs. This simplistic approach was initially adopted for the development of the application. Thereafter, the complexity was increased to include more inputs, processes and outputs for each factory. The capabilities of SCDT were then expanded with respect to factory representation and visualization. The visualization module can update SCDT’s state, from either autonomous evolution of the collective, or from message inputs from users or from other applications.
Moreover, the SCDT can be used to test alternative scenarios for circular intra-factory logistics and circular supply chain arrangements.
Why use the SCDT tool?
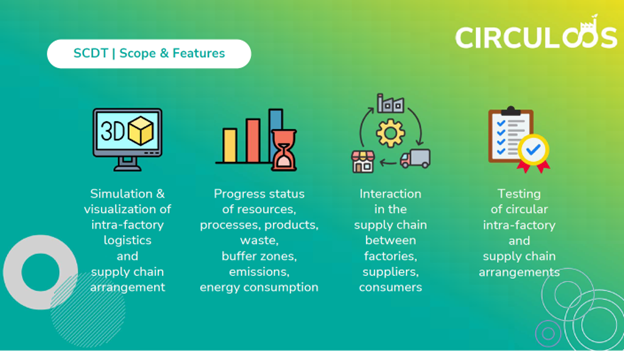
The SCDT tool provides:
- Simulation and visualisation of factory processes, materials, products, input and output resources including near real-time monitoring visualisation.
- Simulation, visualisation and interaction with production and supply chain operations among actors in the supply chain, including near real-time monitoring visualisation.
- Remote web viewing capability of SCDT
- Material flow visualisation
- Near real-time correspondence capability between the SCDT and the data platform.
- Automatic simulation creation and execution based on appropriate factory and supply chain descriptions, triggered by data platform requests.
How to use SCDT?
The SCDT tool is provided as a Software-as-a-Service running at Cyprus University of Technology server premises. A simulation is developed for each request, and the application returns a link via which the user can see and interact with the SCDT through their web browser. The users can use them to view and interact with the simulation on their browser.
The SCDT tool follows the standard EU regulations utilizing authentication for the communication between the tool to secure the confidentiality, protection and data sharing of the experiments. So, all data provided by the users is confidential.
Data collection template
In order to utilize the SCDT and construct the 3D simulation of the factory and the supply chain, we need to collect the necessary data from the participating factories. For this reason, the data collection templated needs to be completed. The template was developed to describe a wide range of processes and factory setups. The SCDT implementation has a variable level of simulation granularity, reflecting the level of detail of information provided by the pilots. This allows each factory to provide information at the level of abstraction and/or granularity that is considered necessary, to appropriately reflect their role in the circular supply chain within the SCDT implementation. The information collected captures the complexity and variation of the pilot setups. A video detailing the use of the template for data collection is provided on how to fill the template
SCDT connectivity with the Data Platform
The simulation models on SCDT are based on user’s requirements and updates the visualized data either through real time inputs from the factories that are available on the Data Platform or through simulated data based on factory the definition (according to user inputs).
An example of a Factory Representation on SCDT
Using the data of the template, the digital twin model is developed to visualize the factory representation. An example of a digital twin model of a factory is illustrated in Figure 1.
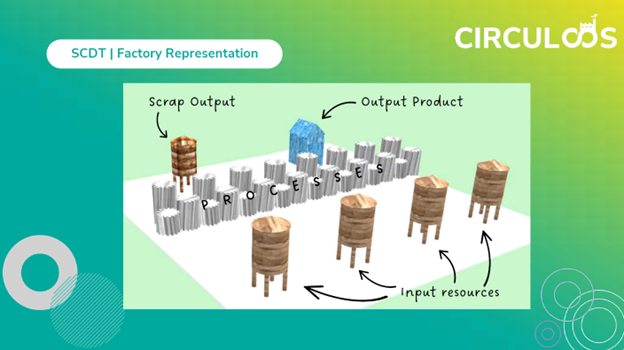
The SCDT provides an abstract visualization of the intra-factory operations with respect to the input materials, output products, processes and waste of scrap. The emphasis here is the potential of the factory to receive and produce products and scraps that can be utilized in the circular supply chain and not so much to capture the factory workflow in detail.
For the implementation of the Digital Twin, the factory is considered as a system with inputs and outputs and some buffers and processes. To build the factory model in the digital twin, the user need to define the input resources of the factory, the products produced, the waste of scrap, the internal processes along with their LCA costs. The inputs refer to the incoming materials and resources used by the processes. The outputs refer to the products manufactured by the factory and the scrap produced from the processing. By clicking on each entity, the user can see the running information about the status of each entity of the factory. Also, the user can change the icon and texture of each entity and of course he can add as many processes or buffer he prefers.
A problem might be to identify alternative processes, alternative workflow arrangements or storage capacities etc. To solve these kind of problems and provide a solution with optimality characteristics with respect to LCA indicators, we have developed the supply chain optimization (SCOPT) tool
A simulation of different scenarios is demonstrating in the following video presenting the visualization of three supply chains in the same simulation. The scenario describes a factory with different processes being enabled, different products being produced with different emissions indices, and/or using different suppliers
An example of a Supply chain arrangement on SCDT
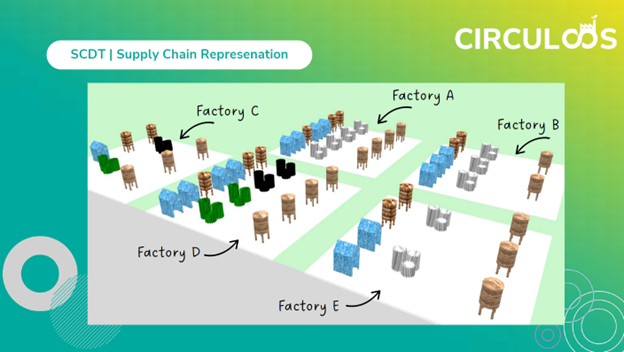
In addition to the intra-factory operation, SCDT provides the supply chain representation of interaction between the actors of the supply chain. An example of a supply chain arrangement is illustrated in Figure 2. This is an example representation of interaction of 5 (five) factories participating in the supply chain.
In this point, we need to identify the interconnections between the actors so as to define circular supply chains. To build the supply chain model in the digital twin, the user needs to define the suppliers per factory, the consumers per factory, and the interconnections between the factory, suppliers and consumers.
For example, the products of a factory can be utilized as inputs of another factory; or the scraps produced by a factory that can be utilized as input from another factory, so as to specify a circular supply chain. Similarly with the case of intra-factory representation, in the supply chain representation you can clink on any of the processes, inputs and outputs of each of the factories to monitor the state of the processes of each factory. Another case here might be that some of the factories have similar inputs, outputs and scraps.
So, the problem now is to identify which are the outputs of the factories that would be connected to which inputs of another factory. To identify the circular supply chain with optimality characteristics based on the available LCA indicators, we have developed the supply chain optimization tool.